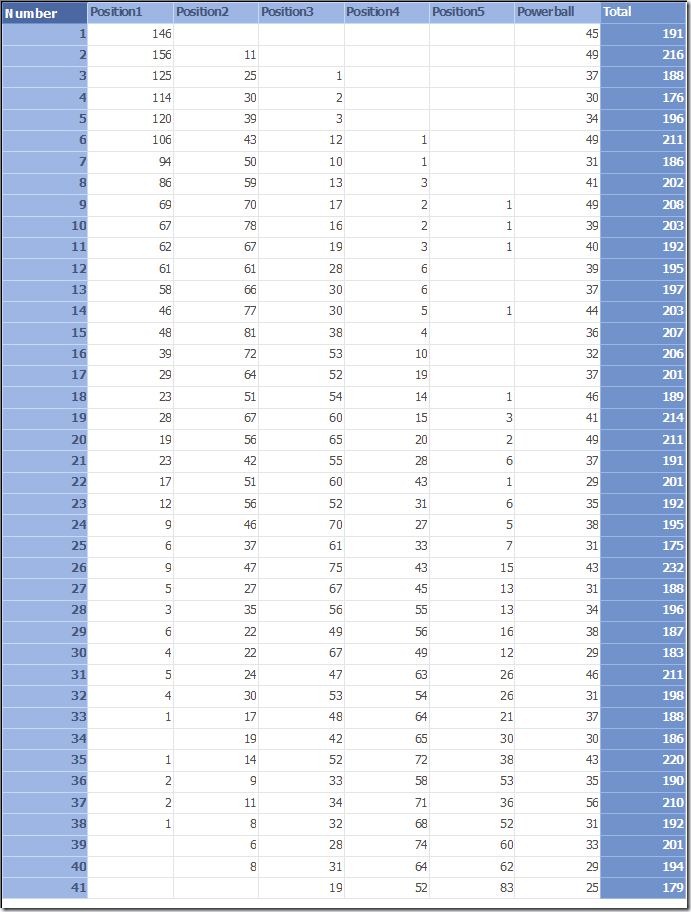
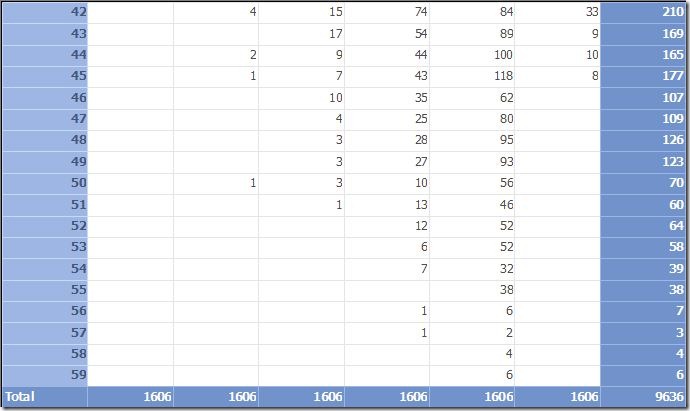
So I am a complete nerd about data. I got lottery data from 1994 to today and decided to visualize it just to see what it shows. I was surprised by the results. Hope you can see the beauty of “random”. I will try and get more visualization at a later by including dates in the equations. Enjoy.
Update (8/28/09) – New Visuals
I created a new visual to show the pattern I was observing (which is really obvious if you think about it). Number 1 is heavily skewed to the lower numbers, Number 2 is skewed to the lower numbers but not as badly and has a nice hump at the 11 mark. Number 3 is almost like the bell curve with similar distributions on both sides. Number 4 skews a little to the higher numbers. Number 5 is skewed heavily to the higher numbers. Finally the Powerball number is an even distribution but I do see some falloff at the end.
Now why does this make sense? Because the numbers are organized from lowest to highest in position 1 through 5 of course!
Stay tuned for more visualizations coming soon!


